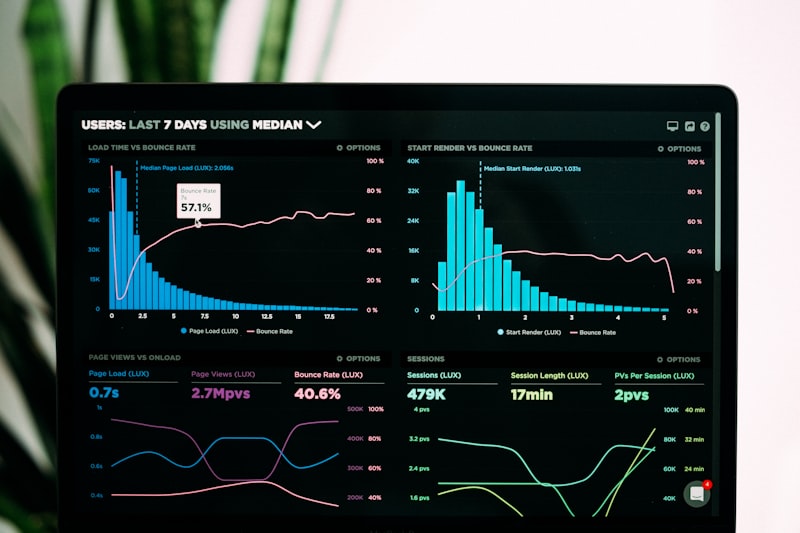
Turn Data Into Decisions.

Stop making decisions on gut feel. Techhold Developers builds BI dashboards, data warehouses, and reporting systems that give Kenyan businesses a single source of truth — from M-Pesa to ERP, from sales to ops, in real time.

📊
70+ BI Rollouts in Kenya
🔗
40+ Data Source Types
⚡
Real-Time Reporting
analytics.techholddev.com
Executive Dashboard · Q4
LIVE
REVENUE
KES 48.2M
↑ 18.4%
ORDERS
12,847
↑ 9.2%
MARGIN
32.6%
↓ 1.1%
WEEKLY SALES
This Yr
Last Yr
CHANNEL
SALES
GROWTH
Retail Stores
KES 22.4M
+14%
E-Commerce
KES 16.8M
+28%
Wholesale
KES 9.0M
+6%

Why Kenyan Businesses Lose Money Without Real Analytics

If your data lives in Excel files, WhatsApp messages, and disconnected systems, you're making multi-million shilling decisions on incomplete information.

📂

Data Silos

Sales, finance, ops, and M-Pesa data live in disconnected systems — no single truth.

📊

Spreadsheet Chaos

Manual Excel reports go stale, break often, and can't be trusted for decisions.

🐌

Slow Reporting

Waiting days or weeks for reports kills agility and slows down decisions.

🔍

No Visibility

You can't see per-branch, per-product, or per-rep performance in real time.

📉

Missed Trends

Declining margins, rising costs, and shifting demand are noticed too late.

🧮

No Forecasting

Without forecasting, budgeting and inventory planning become educated guesswork.

Analytics & BI Services

End-to-end analytics services for Kenyan businesses — from data strategy and warehousing to dashboards, AI, and ongoing analytics support.

🧭

Data Strategy & Consulting

Data maturity assessment, KPI design, and analytics roadmap.

🏗️

Data Warehouse Engineering

Modern cloud warehouses on BigQuery, Snowflake, Redshift, and Postgres.

🔗

ETL & Data Pipelines

Airflow, dbt, Fivetran, and custom pipelines feeding clean data daily.

📊

BI Dashboard Development

Power BI, Tableau, Looker Studio, Metabase, and Superset dashboards.

🎨

Custom Analytics Apps

Bespoke reporting apps built with React, D3.js, and modern stacks.

🤖

AI & Predictive Analytics

Forecasting, churn prediction, segmentation, and anomaly detection.

📱

M-Pesa & Payments Analytics

Real-time visibility on transactions, float, and reconciliation.

🖥️

Executive Reporting Portals

Board-level and management dashboards built for decision speed.

🔍

Data Quality & Governance

Data cleansing, validation rules, and governance frameworks.

📈

Forecasting & Scenario Planning

Driver-based models for revenue, cost, and cash forecasting.

🎓

Team Training & Enablement

Power BI, SQL, and analytics training for your internal team.

🛠️

Support & Managed Analytics

Ongoing dashboard support, data ops, and analytics enhancement.

Our Analytics & BI Process

A structured process designed to deliver quick wins, then scale to a full data platform — without disrupting your operations.

01 — DISCOVER

Discover & Design

Data audit, KPI definition, and analytics roadmap.

02 — BUILD

Model & Build

Warehouse, pipelines, and core dashboards delivered.

03 — DELIVER

Rollout & Train

Dashboard rollout, training, and adoption planning.

04 — OPTIMIZE

Support & Optimize

New reports, enhancements, and data ops support.

Decision-Ready Dashboards

Your executive team doesn't have time for spreadsheets. We build dashboards that surface what matters — revenue, margin, growth, operations — in seconds.

  • Revenue, cost, and margin at a glance
  • Branch, product, and sales rep performance
  • Cash flow and working capital visibility
  • Drill-down from company to transaction level
  • Mobile access for leadership on the go
  • Automated email and WhatsApp alerts
Executive BI dashboard for Nairobi business

One Source of Truth

BI is only as good as the data behind it. We build modern cloud data warehouses and ETL pipelines that consolidate every source into a reliable, analytics-ready layer.

  • Cloud warehouses: BigQuery, Snowflake, Redshift, Postgres
  • ETL/ELT with Airflow, dbt, Fivetran, and custom code
  • Batch and real-time pipelines
  • Data quality checks and validation rules
  • Documented schemas and data dictionary
  • Row-level security and access controls
Cloud data warehouse architecture for Kenyan business

See Every Shilling, Every Day

M-Pesa is the heartbeat of Kenyan business. We connect M-Pesa, banks, cards, and cash into a unified payments analytics layer — with reconciliation built in.

  • M-Pesa Daraja API integration (STK, Paybill, Till)
  • Auto-reconciliation with sales and invoices
  • Float monitoring and low-balance alerts
  • Agent, branch, and merchant performance
  • Customer payment behavior analytics
  • Bank and card transaction consolidation
M-Pesa payment analytics dashboard in Kenya

From Reporting to Forecasting

The best analytics doesn't just tell you what happened — it tells you what's likely to happen next. We build forecasting, segmentation, and predictive models that drive proactive decisions.

  • Revenue and demand forecasting
  • Customer churn prediction
  • Customer segmentation and CLV
  • Inventory and stockout prediction
  • Anomaly and fraud detection
  • Scenario and what-if planning
AI and predictive analytics for Kenyan business

Every Analytics Solution We Build Includes

The features that make analytics reliable, trusted, and actually used.

⚡

Real-Time Dashboards

Live data with configurable refresh intervals.

🔗

Multi-Source Integration

Databases, M-Pesa, ERP, CRM, POS, and APIs.

🔍

Drill-Down Analysis

From company KPIs to individual transactions.

👥

Role-Based Access

Every user sees only what they should see.

📧

Scheduled Reports

Email and WhatsApp delivery on your schedule.

📱

Mobile Access

Dashboards optimized for phones and tablets.

🧪

Data Quality Checks

Validation rules and anomaly alerts on data.

🔒

Security & Compliance

Encryption, audit logs, and Data Protection Act alignment.

Data Sources We Connect

Databases, payments, ERPs, CRMs, and SaaS tools — consolidated into one truth.

📱

M-Pesa

Daraja API

🗄️

MySQL

Postgres & SQL Server

🧾

Sage

Accounting

📗

QuickBooks

Accounting

🟣

Odoo

ERP

🛒

POS Systems

Sales & inventory

🎯

HubSpot

CRM

☁️

Salesforce

CRM

📈

GA4

Web analytics

📊

Google Sheets

Spreadsheets

🛍️

Shopify

eCommerce

📦

WooCommerce

eCommerce

☁️

BigQuery

Warehouse

❄️

Snowflake

Warehouse

🔷

Redshift

Warehouse

🔗

REST APIs

Any data source

Analytics & BI Deliverables

Every engagement produces documented, business-ready outputs — not just charts.

✓

Data Strategy Document

Maturity assessment, KPIs, roadmap, and success metrics.

✓

Data Warehouse

Analytics-ready cloud warehouse with documented schemas.

✓

ETL & Data Pipelines

Reliable pipelines with monitoring and validation.

✓

Executive Dashboards

Board-ready dashboards built for decision speed.

✓

Operational Dashboards

Branch, sales, ops, and finance dashboards for teams.

✓

Data Dictionary & Docs

Full documentation for every metric and data source.

✓

Forecasting Models

Where applicable: revenue, demand, and churn models.

✓

Team Training

Power BI, SQL, and analytics training with manuals.

✓

Support & Managed Analytics Plan

Ongoing support, monitoring, and analytics enhancement.

Analytics Case Study

How a Nairobi multi-branch retailer turned fragmented data into a real-time BI platform.

BI platform case study for Nairobi retailer

Nairobi Multi-Branch Retailer

Problem: Reports were pulled manually from POS, ERP, and M-Pesa. Month-end reporting took 9 days, decisions were delayed, and stock and margin issues were often caught too late.

Solution: Techhold Developers built a cloud data warehouse, ETL pipelines from POS, ERP, and M-Pesa, and executive + operational dashboards in Power BI — with automated daily email and WhatsApp reports.

9d → 1h
Month-End Reporting
+18%
Gross Margin Improvement
-27%
Stockouts Across Branches
8
Weeks to Go-Live

What Our Clients Say

Real outcomes from Techhold Developers' analytics and BI projects in Kenya.

★★★★★

"We went from 9-day month-end reporting to a live dashboard our directors check every morning. Gross margin improved by 18% in the first quarter after rollout — because we finally saw where we were leaking money."

★★★★★

"Techhold consolidated M-Pesa, ERP, and CRM data into one platform. Our sales team now sees pipeline and payments in real time — and Finance finally trusts the numbers."

Analytics & BI FAQs

Answers to the questions we hear most from Kenyan businesses.

How much does a BI dashboard cost in Kenya?
BI dashboards in Kenya typically range from KES 180,000 for a focused single-department dashboard to KES 3,000,000+ for enterprise data platforms with warehouses, ETL pipelines, and multiple dashboards. Pricing depends on data sources, complexity, and user count. Techhold Developers provides fixed-scope proposals after a discovery workshop.
Which BI tools do you build with?
We build with Power BI, Tableau, Looker Studio, Metabase, Apache Superset, and custom-built dashboards using React, D3.js, and modern charting libraries. We recommend the tool based on your existing stack, budget, and team skills.
Can you connect multiple data sources into one dashboard?
Yes. We connect databases, M-Pesa, ERP systems, CRMs, POS systems, Google Analytics, Excel files, and APIs — consolidating them into a single source of truth for reporting.
Do you build data warehouses?
Yes. We design and build modern cloud data warehouses on BigQuery, Snowflake, Redshift, and Postgres — with ETL pipelines from your operational systems using Airflow, dbt, Fivetran, and custom code.
How long does a BI project take?
A focused single dashboard takes 3–6 weeks. A full data platform with warehouse, pipelines, and multiple dashboards typically takes 8–16 weeks. We phase delivery so you see value early.
Do you train our team on the dashboards?
Yes. Every project includes role-based training for executives, managers, and analysts, plus documentation, playbooks, and (optionally) Power BI and SQL training for your internal team.
Can you work with our existing data team?
Yes. We often work alongside internal analysts, data engineers, or IT teams — building the platform, then handing over with full documentation and training so your team can own it long-term.
Is my data secure?
Yes. We apply encryption at rest and in transit, role-based access controls, audit logs, and alignment with Kenya's Data Protection Act. We can deploy entirely within your cloud tenant if required.
Do you provide ongoing support?
Yes. We offer monthly retainers covering dashboard support, data ops monitoring, pipeline maintenance, enhancements, and new report requests. Analytics is a continuous practice — not a one-off project.
Do you work with businesses outside Nairobi?
Yes. We deliver analytics and BI services to businesses across Kenya — including Mombasa, Kisumu, Nakuru, Eldoret, Thika, and countrywide — and internationally. All work is delivered remotely with regular video reviews and shared project dashboards.
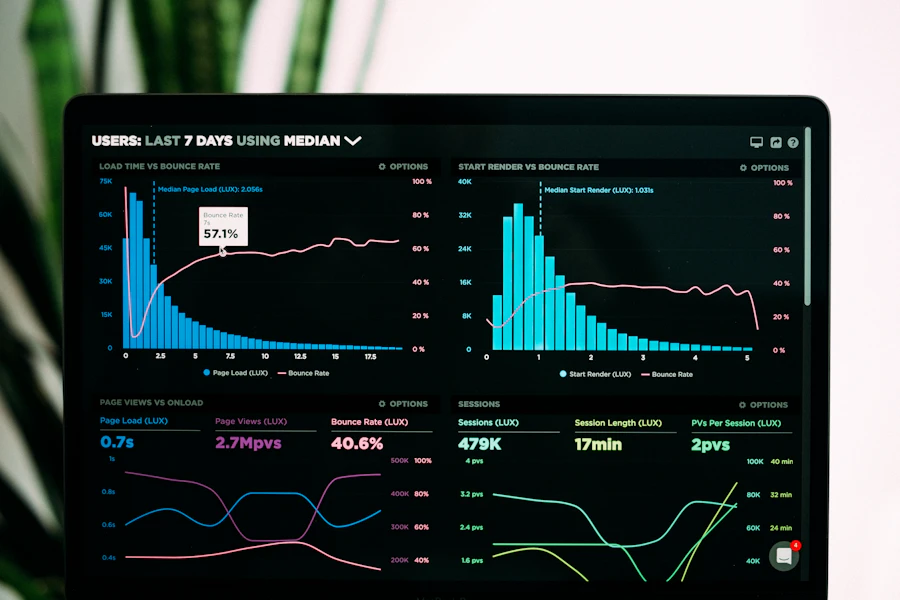
Book Your Data & Analytics Audit

A 60-minute session with a senior analytics consultant to review your data, KPIs, and reporting — and outline a prioritised BI roadmap. No obligation, no pressure.

Book Audit →
Data source inventory
KPI & metric review
Reporting pain points
Dashboard demo
Tooling recommendations
Effort & timeline estimate
Budget guidance
Prioritised roadmap